Evaluation
Precision and fitness (or recall)
From the perspective of information theory,
Precision $= \cfrac{TP}{TP+FP}$
Fitness (or recall) $= \cfrac{TP}{TP+FN}$
Where,
$TP : $ True positive
$FP : $ False positive
$FN : $ False negative
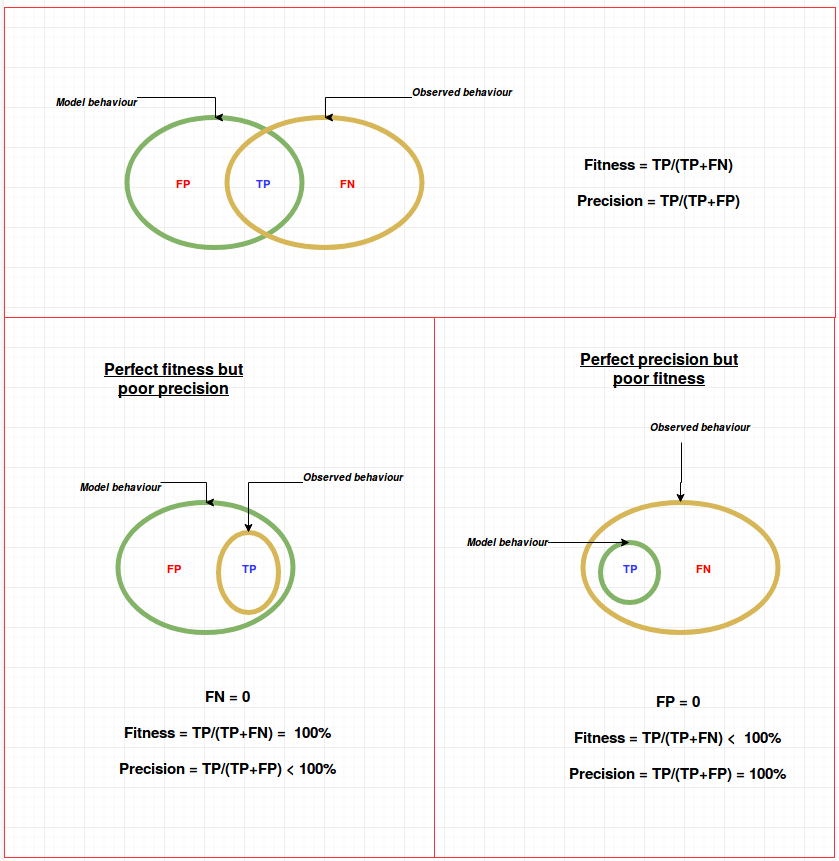
Why both precision and recall are needed?
The venn diagram below illustrates the cases where fitness can be low, when precision is high (and vise versa)
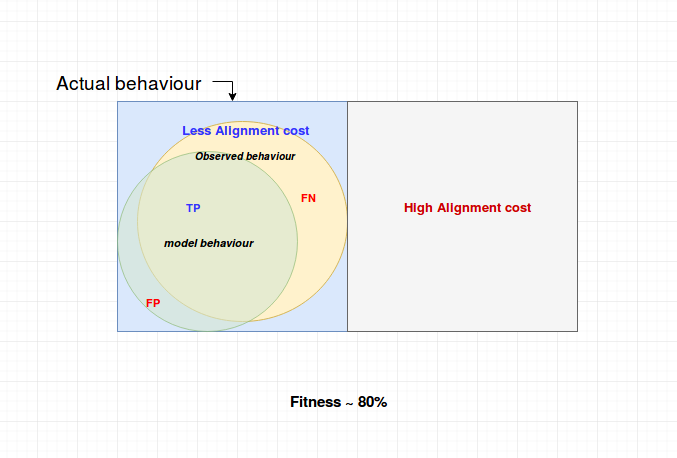
Effect of simplicity on fitness and precision
When more places are added, the model becomes more complex $\implies$ the size of modelled behaviour (in the diagram) decreases $\implies$ Fitness decreases and precision increases
Causal footprint
According to this method (as described in the lecture), we get perfect score only if the observed behaviour is exactly same as modelled behaviour. That is,
Perfect causal foot print match $\implies$ When both fitness and precision according to our definitions is 100%
I see that metrics derived from causal footprints aim to compute metrics similar to F1 score (harmonic mean of precision and fitness)
F1 Score $ = \cfrac{2 \times \text{Precision x Fitness}}{\text{Precision + Fitness}}$
Eg, Flower model will have less precision score even with perfect fitness. Thus, causal footprints can identify underfitting
Token based conformance checking
Quantifies just fitness.
Flower model can get a perfect score
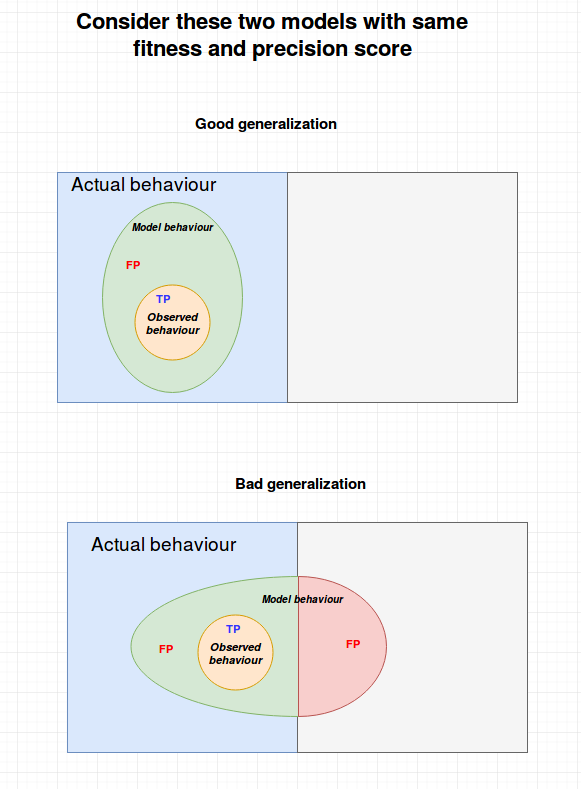
Need for generalization metric
In most cases, the observed behaviour (in the event log) may be just a partial of the actual behaviour
Precision and fitness are computed only in relation to the observed behaviour. Therefore, in case of partial observation, it may be necessary to differentiate two models with same precision and fitness score, in terms of generalization.
Evaluation - Balance of 4 forces
1) Observed behaviour should (probablisticaly) approximate the actual behaviour as much as possible
2) Fitness or precision should be approx 80%. This will prevent underfitting (flower model) and overfitting (restricts the number of places to maintain simplicity)
Underfitting $\implies$ High fitness
Overfitting $\implies$ High precision
3) Assign the costs of legal moves in such a way that the cost is high for paths that are not allowed